Free 14-Day Access ON TELEGRAM
Part 7: Corrective Wave Structures and Fibonacci Relationships in Elliott Wave
Corrective waves are where Elliott Wave analysis either becomes precise or confusing. Unlike impulse waves, corrections often unfold sideways, overlap internally, and test patience. Understanding their structure — and the Fibonacci relationships that govern them — is essential for maintaining clarity during non-trending phases. This lesson focuses on the corrective toolkit: triangles, combinations, and Fibonacci relationships that help validate structure and anticipate resolution.
Understanding Triangle Corrections
Triangles are corrective patterns that move sideways rather than trend. They subdivide into five waves, labelled A–B–C–D–E, and typically reflect a pause before the final phase of a larger move.
Their internal structure is almost always corrective, forming a 3–3–3–3–3 pattern. This distinguishes triangles from impulsive formations.
Triangles most commonly appear:
As wave 4 within an impulse
As wave B within a larger correction
As the final structure within a complex correction
They do not appear as a standalone wave 2.
Triangle Variations
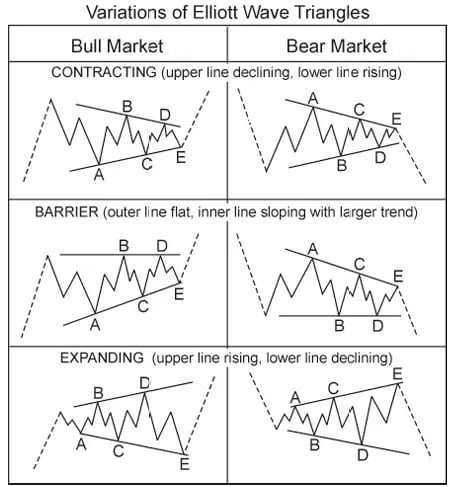
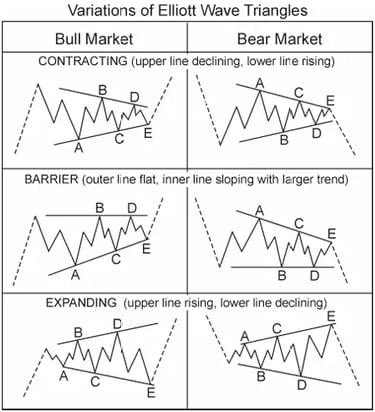
Triangles form in several variations, each defined by the behaviour of its boundaries.
Contracting triangles (most common) gradually narrow as each wave becomes smaller
Barrier triangles maintain one horizontal boundary while the opposite side contracts
Expanding triangles (rare) widen over time and are relatively rare
Regardless of type, their purpose is the same: consolidation before resolution.
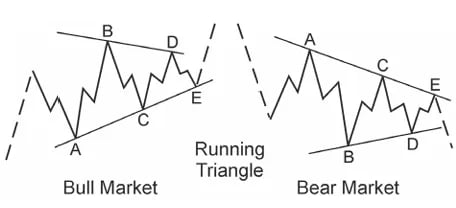
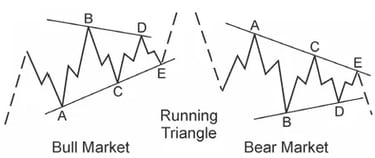
Running Triangles and Trend Strength
When wave B pushes beyond Wave A's origin, the triangle becomes “running.” This variation often signals strong underlying trend pressure.
Rather than weakening the trend, a running triangle suggests the market is compressing energy before continuation. These formations often precede sharp directional moves.
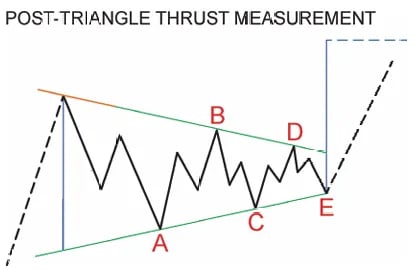
The Post-Triangle Thrust
Triangles are valuable because they typically precede the final motive wave of a sequence. Once the triangle resolves, price often accelerates quickly. The post-triangle thrust measurement offers a reliable way to gauge how far price is likely to move once a triangle breakout occurs.
How to measure the thrust:
Draw trendlines connecting waves A-C and B-D
Extend these lines back to wave A's starting point
Measure the vertical distance between the trendlines (the triangle's "width")
Apply this width from wave E's endpoint to estimate the minimum thrust target
If you identify a triangle, expect one more motive wave to follow - triangles always precede the final move.
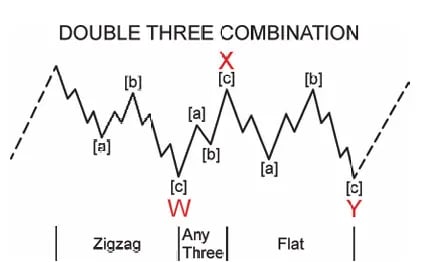
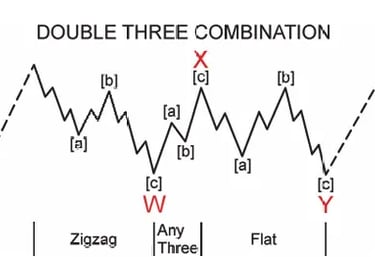
Complex Corrections and Combinations
Not all corrections resolve cleanly. When markets require more time or need to retrace more deeply, they may link multiple corrective structures together. These formations are known as combinations.
Combinations:
Include two or more corrective structures (limit appears to be three)
Each structure is linked by an X wave that moves opposite to the previous pattern
X waves are usually zigzags (and can have an impulsive look to them) but they can be any corrective pattern except triangles
Only one triangle can appear in a combination, and it's always the final structure
W-X-Y combinations also display signs of alternation, for example, if the W wave is a flat (sideways correction), the Y wave will often alternate as a zigzag (sharp correction), and vice versa. This alternation helps identify and differentiate the internal corrective structures.
Only one triangle can appear in a combination, and it always occurs at the end.
While frustrating to trade internally, combinations often lead to decisive moves once complete.
Fibonacci Relationships as Structural Validation
Fibonacci ratios provide proportional context within Elliott Wave. Rather than predicting exact turning points, they help determine whether a structure remains consistent with its guidelines.
In impulse waves:
Wave 2 usually retraces about 61.8% of wave 1 (deep correction)
Wave 4 usually retraces about 38.2% of wave 3 (shallow correction)
This alternation between deep and shallow corrections is one of Elliott Wave's most reliable guidelines. So if wave 2 is deep look for wave 4 to be shallow and vice versa.
These ratios help traders assess whether a developing wave is behaving normally or becoming structurally suspect.
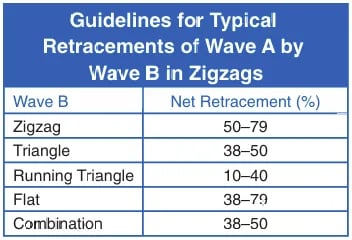
In zigzag corrections, wave B's retracement of wave A depends on B's internal structure:
If wave B is a zigzag: 50-78.6% retracement
If wave B is a triangle: 38.2-50% retracement
If wave B is a flat: 38.2-78.6% retracement
Retracement Behaviour in Corrective Waves
Different corrective structures exhibit different retracement tendencies.
Sharp corrections often retrace deeply
Sideways corrections tend to retrace less in price but consume more time
Alternation between these behaviours is a recurring guideline
Understanding these tendencies helps maintain realistic expectations during consolidation.
Wave Length Proportions and Equality
In both impulsive and corrective waves, proportional relationships frequently repeat.
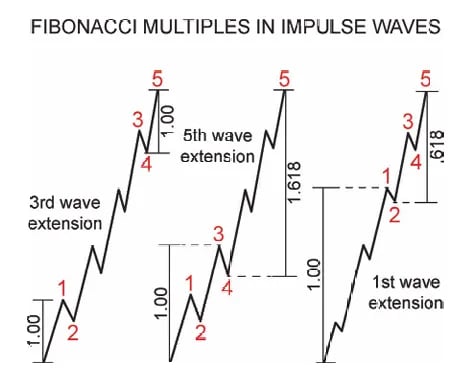
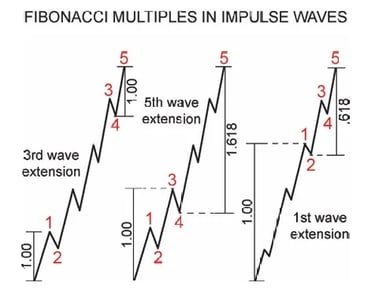
For impulse waves:
When wave 3 is extended, wave 5 often equals wave 1 or 61.8% of wave 1
When wave 5 is extended, it typically travels 161.8% of waves 1-3 combined
When wave 1 is extended, waves 3-5 combined often equal 61.8% of wave 1
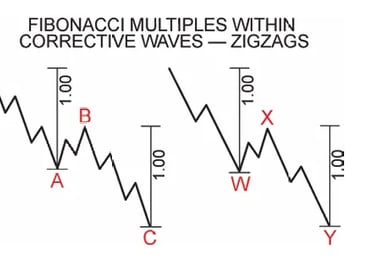
For zigzag corrections:
Most common relationship: Wave C equals wave A (equality)
Alternative relationships: C = 61.8% of A, or C = 161.8% of A
In double zigzags: Wave Y typically equals wave W
These relationships help traders avoid forcing interpretations that do not align with observed proportions.
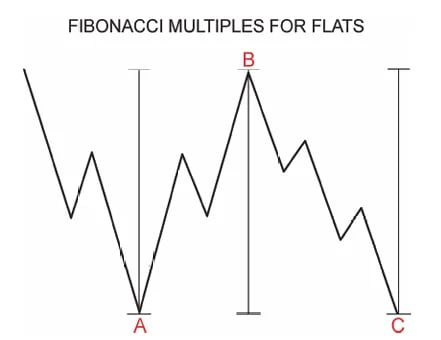
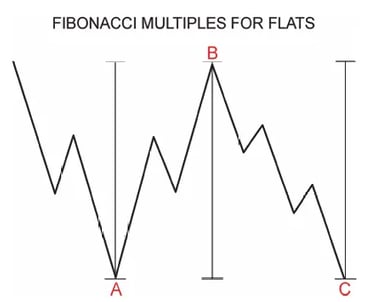
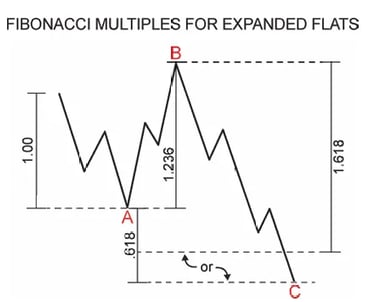
Flat Correction Fibonacci Relationships
Regular flats: Waves A, B, and C are generally equal in length
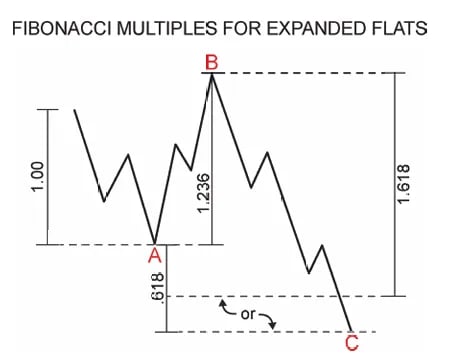
Expanded flats (more complex but more common):
Wave C = 161.8% of wave A, or
Wave C terminates 61.8% of wave A beyond wave A's endpoint
Wave B = 123.6% or 138.2% of wave A
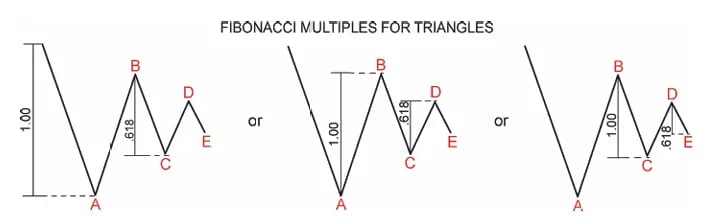
Contracting Triangle Correction of Fibonacci Relationships
Wave C = 61.8% of Wave B
Wave D = 61.8% of Wave C
Wave E = 61.8% of Wave D These relationships help validate triangle structure and identify likely termination points for each leg.
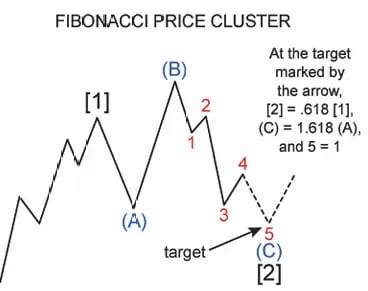
Fibonacci Clusters and High-Probability Zones
The most useful Fibonacci insight comes not from a single ratio, but from confluence.
A Fibonacci cluster forms when multiple independent measurements point to the same price area. These zones often act as:
Correction termination points
Extension objectives
Key reaction levels
Clusters strengthen confidence by aligning structure with proportion, when 2 or more Fibonacci relationships align, the probability of a market turning point increases significantly.
How This Lesson Fits the Series
This lesson provides the structural and proportional foundation for executing Elliott Wave analysis during corrective phases. It explains why patience is often required and how clarity can still be maintained when price appears directionless.
The next lesson focuses on execution, translating this structural understanding into confirmation-based trade decisions that respect uncertainty.
Elliott Wave Trading Course Series
This article is part of the Elliott Wave Trading Course.
Lessons in this series:
Part 2: The Simple Market Structure That Explains Every Price Move
Part 3: Why Elliott Wave Provides More Context Than Traditional Indicators
Part 4: The Elliott Wave Phases That Offer the Clearest Trading Opportunities
Part 7: Corrective Wave Structures and Fibonacci Relationships in Elliott Wave
Part 8: Applying Elliott Wave Structure with Confirmation-Based Trade Execution
Part 9: Risk Management and Psychology


Disclaimer:
Trading forex involves significant risk and may not be suitable for all investors. Past performance is not indicative of future results. The information and signals provided on this website are for educational purposes only and should not be considered financial advice. You are solely responsible for your trading decisions and any resulting financial losses. Please consult with a licensed financial advisor before engaging in forex trading.
© 2026. All rights reserved.
Trading Resources: [Market Insights] [Elliott Wave Course] [Forex Signals Guide] Tools: [Economic Calendar ][Position Size Calculator] Support: [FAQ] [Contact] [New To Telegram?]