Free 14-Day Access ON TELEGRAM
Part 2: The Simple Market Structure That Explains Every Price Move
Financial markets often appear chaotic, but beneath that surface movement lies a repeating structure. This structure was identified in the 1930s by Ralph Nelson Elliott, who observed that price movements unfold in recognisable sequences rather than random fluctuations. His key insight was that markets move in waves — and that these waves repeat in a consistent rhythm across all timeframes.
The Five-Wave Structure That Drives Trends
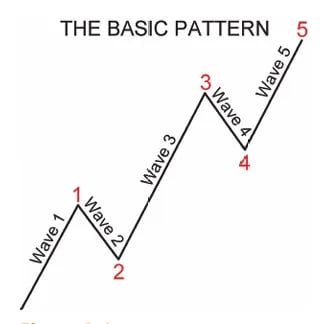
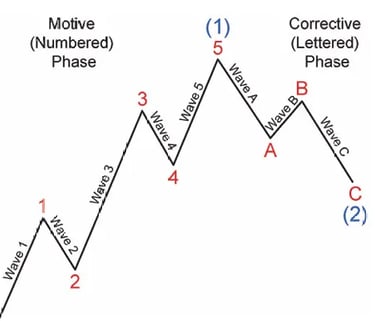
At the core of Elliott Wave theory is a simple idea: markets advance in a five-wave sequence when moving with the dominant trend.
This sequence is known as a motive wave, because it propels price forward.
The structure is made up of:
Waves 1, 3, and 5, which move in the direction of the main trend
Waves 2 and 4, which temporarily move against that trend
Even though price pulls back during waves 2 and 4, the overall direction remains intact.
A helpful way to visualise this is progression with pauses. Price advances, corrects, advances again, pauses once more, and then completes the move.
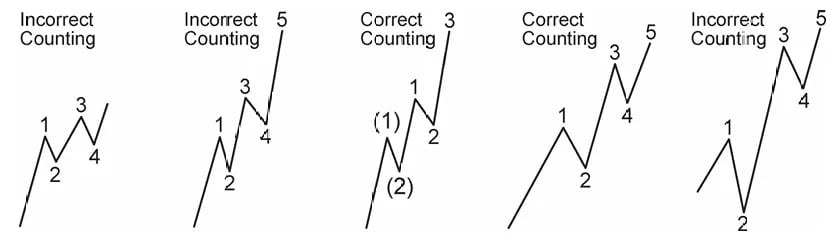
The Two Core Rules That Define Motive Waves
Motive waves follow strict structural rules. These are not guidelines — they are requirements.
Two rules must always be respected:
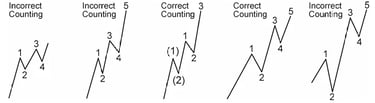
Wave 2 must not retrace beyond the start of wave 1
Wave 3 must not be the shortest of waves 1, 3, and 5
If either rule is broken, the structure cannot be a valid motive wave and the analysis must be reassessed.
These rules provide something many trading methods lack: clear invalidation.
What Follows the Five-Wave Advance
Once a five-wave motive sequence completes, the market typically shifts into a corrective phase.
Corrections usually unfold in a three-wave pattern, labelled A–B–C, and move against the direction of the preceding trend. Their purpose is not to reverse the market immediately, but to relieve imbalance before the next directional phase begins.
Corrections tend to retrace part — but not all — of the prior move.
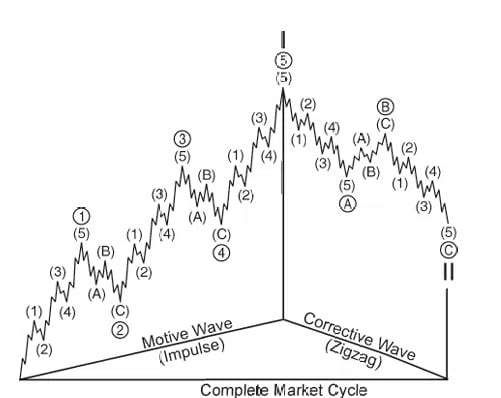
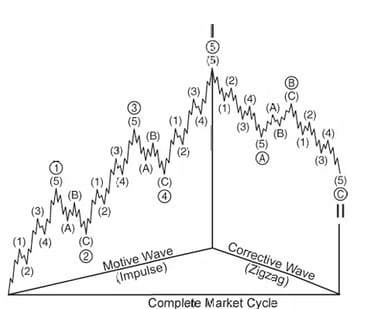
Waves Exist at Every Scale
One of the most important aspects of Elliott Wave is its fractal nature.
Every wave is made up of smaller waves, and every wave is part of a larger one. The same five-wave and three-wave structures repeat across:
Intraday charts
Daily charts
Weekly and long-term charts
This repetition allows Elliott Wave to be applied consistently, regardless of the timeframe or market.
Two Types of Motive Waves
Not all motive waves look the same. There are two primary forms.
Impulse Waves
Impulse waves are the most common and the strongest. They follow all motive-wave rules and typically show clear momentum with limited overlap.
Diagonal Waves
Diagonal waves also move in the direction of the trend, but they behave differently and often appear at important transition points. These structures will be explored in more detail later in the series.
Why This Structure Matters
Understanding the basic five-wave advance followed by a three-wave correction gives traders a powerful framework.
It allows you to:
Identify where price sits within a broader cycle
Anticipate what type of movement is likely to come next
Recognise when an interpretation is no longer valid
Focus attention on the most meaningful phases of price action
Instead of viewing markets as unpredictable noise, structure provides context.
How This Lesson Fits the Series
This lesson introduces the core market rhythm that underpins all Elliott Wave analysis.
The next lesson explains why this framework offers more context than traditional indicators, and how structure adds meaning to signals that would otherwise appear isolated.
Elliott Wave Trading Course Series
This article is part of the Elliott Wave Trading Course.
Lessons in this series:
Part 2: The Simple Market Structure That Explains Every Price Move
Part 3: Why Elliott Wave Provides More Context Than Traditional Indicators
Part 4: The Elliott Wave Phases That Offer the Clearest Trading Opportunities
Part 7: Corrective Wave Structures and Fibonacci Relationships in Elliott Wave
Part 8: Applying Elliott Wave Structure with Confirmation-Based Trade Execution
Part 9: Risk Management and Psychology


Disclaimer:
Trading forex involves significant risk and may not be suitable for all investors. Past performance is not indicative of future results. The information and signals provided on this website are for educational purposes only and should not be considered financial advice. You are solely responsible for your trading decisions and any resulting financial losses. Please consult with a licensed financial advisor before engaging in forex trading.
© 2026. All rights reserved.
Trading Resources: [Market Insights] [Elliott Wave Course] [Forex Signals Guide] Tools: [Economic Calendar ][Position Size Calculator] Support: [FAQ] [Contact] [New To Telegram?]