Free 14-Day Access ON TELEGRAM
Part 6: Diagonal Waves and Corrective Structures in Elliott Wave Analysis
Not all motive waves behave the same way. While diagonal waves are classified as motive structures, they differ significantly from standard impulses and often signal important transitions within a market. Recognising diagonals — and understanding how they interact with corrective patterns — helps traders avoid mislabelling structure during periods of trend exhaustion or early trend development.
How Diagonal Waves Differ From Impulses
The defining feature of a diagonal wave is overlap.
Unlike impulse waves, where wave 4 must not overlap wave 1, diagonals always display overlap between these waves. This overlap is not a flaw — it is the key structural signal that distinguishes a diagonal from an impulse.
Diagonals typically appear when momentum is weakening or when a trend is just beginning to form.
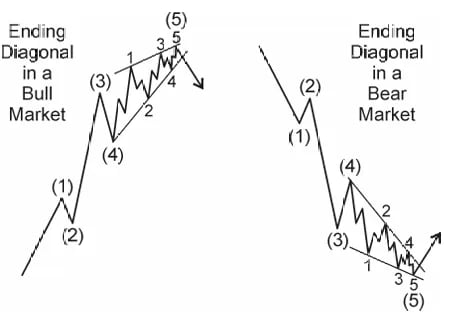
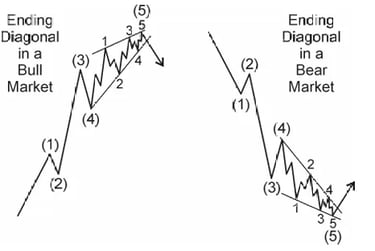
Ending Diagonals and Market Exhaustion
Ending diagonals are the most frequently observed diagonal structure and are particularly valuable for context.
They form a wedge-like shape, defined by:
A trendline connecting waves 1 and 3
A converging trendline connecting waves 2 and 4
Internally, all five subwaves subdivide as corrective structures, usually zigzags. This lack of impulsive strength reflects exhaustion rather than expansion.
Ending diagonals commonly appear:
As wave 5 of an impulse
As wave C of a corrective pattern
What Typically Follows an Ending Diagonal
Ending diagonals often precede rapid reversals.
Once complete, price frequently retraces the entire diagonal — and sometimes more — in a fraction of the time it took to form. This behaviour reinforces the idea that diagonals represent distribution rather than continuation.
Because of this tendency, diagonals often mark the final phase of a larger move.
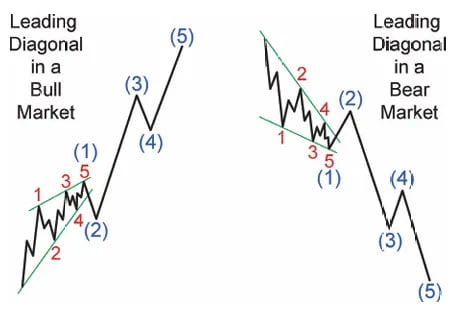
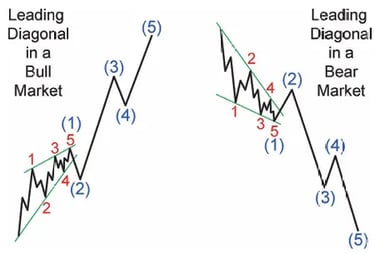
Leading Diagonals and Early Trend Development
Leading diagonals are far less common in equities (but common in the forex markets), they play an important role when they appear.
They can form as:
Wave 1 of a new impulse
Wave A of a zigzag correction
In contrast to ending diagonals, leading diagonals may show impulsive internal behaviour in waves 1, 3, and 5, while waves 2 and 4 remain corrective.
Following a leading diagonal, the subsequent correction is often deep, reflecting the market’s need to test the newly established structure.
Corrective Waves as Market Consolidation
Corrective waves represent the market’s pauses between directional phases. Rather than moving in a straight line, price alternates between expansion and consolidation.
Corrective behaviour generally falls into two broad categories:
Sharp corrections, which retrace quickly and decisively
Sideways corrections, which consume more time than price
Understanding this distinction helps set realistic expectations during consolidation.
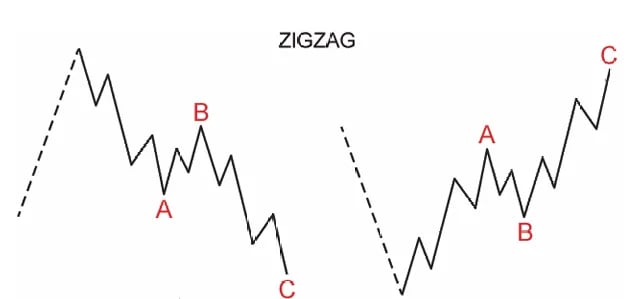
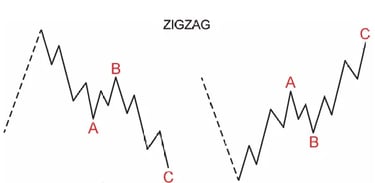
Zigzag Corrections: Sharp and Directional
Zigzags are clean, directional corrections that unfold in three waves.
Their internal structure follows a 5–3–5 sequence:
The first leg moves impulsively
The middle leg retraces
The final leg completes the correction
Zigzags typically move swiftly and retrace a meaningful portion of the prior trend, making them easier to recognise than more complex corrections.
Key behavioural tendencies include:
Wave C slope: Wave C is usually less steep (more shallow in slope) than wave A, creating a visual deceleration that signals the correction is losing momentum
Wave C length: Commonly equals wave A in price length, though it can also measure 61.8% or 161.8% of wave A
Wave B retracement: Usually retraces 38.2%, 50%, or 61.8% of wave A and should never exceed wave A's starting point
Alternation principle: Waves A and C can alternate in complexity:
If wave A is simple, sharp, and explosive → expect wave C to be more complex and measured
If wave A is complex with multiple internal waves → expect wave C to be more straightforward
Trading significance: This alternation helps you anticipate how the pattern will complete and position for the main trend resumption once the zigzag correction finishes
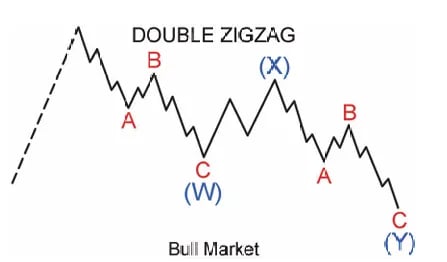
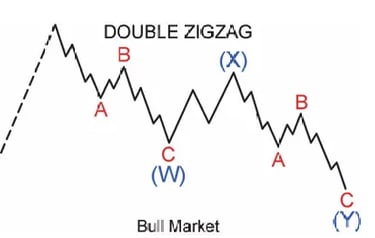
Double Zigzags and Persistent Trend Pressure
When a single zigzag fails to achieve sufficient correction in terms of time or price, the market typically responds by extending the corrective phase, often evolving into a more complex structure. The market may then link multiple zigzags together.
These formations reflect strong underlying trend pressure and often appear when the market is unwilling to move sideways for long. While frustrating during development, they frequently precede powerful trend continuation once complete.
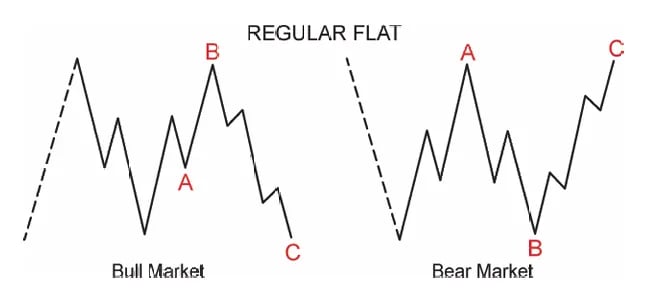
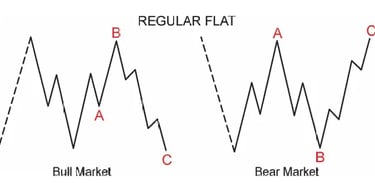
Flat Corrections and Sideways Movement
Flats are also corrective formations built from three waves, but their internal makeup differs from that of zigzags.
In a flat correction:
Wave A unfolds as a corrective move, made up of three waves.
Wave B is likewise corrective and subdivides into three waves.
Wave C resolves the structure with a strong motive leg, typically consisting of five waves.
As a result, flats form a 3-3-5 configuration, rather than the 5-3-5 sequence seen in zigzags.
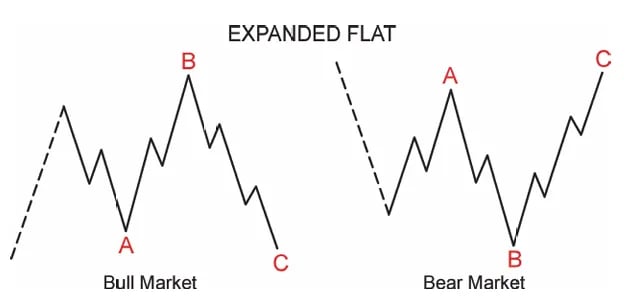
What truly distinguishes flats is the behaviour of wave B. Instead of remaining shallow, wave B commonly retraces 90% or more of wave A, often returning close to its starting point. This deep retracement is usually the first sign that the market is tracing out a flat correction. A further confirmation comes from wave C, which tends to accelerate sharply and travel with a noticeably steeper slope than wave A, giving the structure its characteristic “snap” into completion.
Variations of Flat Corrections
Flats appear in several forms, depending on how far the internal waves retrace.
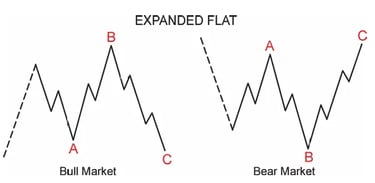
Expanded Flat (Most Common): Wave B ends beyond wave A's starting point, wave C ends substantially beyond wave A's endpoint—creating excellent entry opportunities.
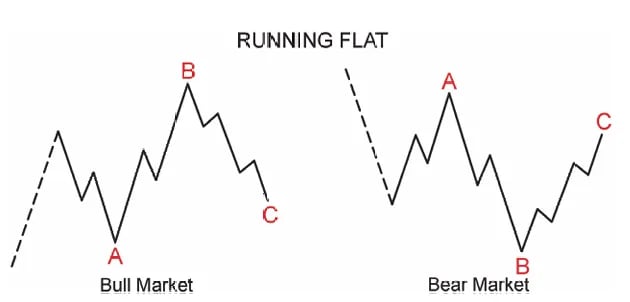
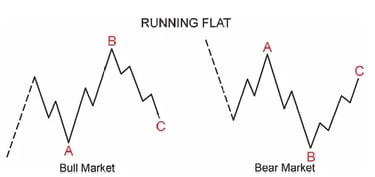
Running Flat (Rare): Wave B ends beyond wave A's starting point, but wave C fails to reach wave A's endpoint—shows exceptional underlying trend strength
Understanding these variations helps traders avoid mistaking consolidation for reversal.
How This Lesson Fits the Series
This lesson establishes how diagonal waves signal transitions and how corrective structures unfold during consolidation. Together, they explain why markets often appear disorderly even when structure remains intact.
The next lesson expands this foundation by exploring triangles, combinations, and Fibonacci relationships, completing the corrective-wave toolkit before execution techniques are introduced.
Elliott Wave Trading Course Series
This article is part of the Elliott Wave Trading Course.
Lessons in this series:
Part 2: The Simple Market Structure That Explains Every Price Move
Part 3: Why Elliott Wave Provides More Context Than Traditional Indicators
Part 4: The Elliott Wave Phases That Offer the Clearest Trading Opportunities
Part 6: Diagonal Waves and Corrective Patterns
Part 7: Corrective Wave Structures and Fibonacci Relationships in Elliott Wave
Part 8: Applying Elliott Wave Structure with Confirmation-Based Trade Execution
Part 9: Risk Management and Psychology
Disclaimer:
Trading forex involves significant risk and may not be suitable for all investors. Past performance is not indicative of future results. The information and signals provided on this website are for educational purposes only and should not be considered financial advice. You are solely responsible for your trading decisions and any resulting financial losses. Please consult with a licensed financial advisor before engaging in forex trading.
© 2026. All rights reserved.
Trading Resources: [Market Insights] [Elliott Wave Course] [Forex Signals Guide] Tools: [Economic Calendar ][Position Size Calculator] Support: [FAQ] [Contact] [New To Telegram?]