Free 14-Day Access ON TELEGRAM
Part 3: Why Elliott Wave Provides More Context Than Traditional Indicators
Most traders rely on familiar tools — moving averages, oscillators, momentum indicators, or sentiment gauges. These tools can be useful, but they all share the same limitation: they describe current conditions, not structural context. Elliott Wave approaches the market differently. Rather than reacting to price behaviour, it explains where price sits within a larger process.
The Limitation of Conventional Indicators
Most technical tools fall into three broad categories:
Trend-following indicators
Oscillators
Sentiment-based measures
They highlight activity, momentum shifts, or extremes, but they rarely answer deeper questions:
Is the trend just beginning or nearing completion?
Is this move impulsive or corrective?
How much potential remains before conditions change?
Without that context, decisions often become reactive rather than structured.
How Elliott Wave Changes the Way Traders See Markets
Elliott Wave does not replace indicators — it reframes them. It provides a structural map that explains how trends develop, pause, and reverse.
Identifying the Dominant Trend
Elliott observed that price advances in a five-wave sequence when moving with the larger trend, and in three-wave sequences when moving against it.
This distinction allows traders to identify whether price is:
Expanding with the trend
Correcting against it
Trading in alignment with the dominant phase reduces the need to predict and increases the focus on participation.
Understanding Corrections as Opportunity, Not Threat
Pullbacks often trigger fear or impatience. Elliott Wave reframes them as corrective structures rather than trend failure.
By recognising three-wave corrections:
Traders gain confidence during retracements
Temporary countertrend moves are separated from reversals
Structure replaces emotion
Corrections become informational rather than alarming.
Measuring Trend Maturity
One of Elliott Wave’s greatest strengths is its ability to show how advanced a trend is.
Because wave patterns repeat at multiple degrees:
Traders can identify whether a move is early, mid-stage, or late
Risk exposure can be adjusted accordingly
Aggressive positioning can be reduced near structural completion
This perspective is difficult to obtain from indicators alone.
Establishing Objective Price Expectations
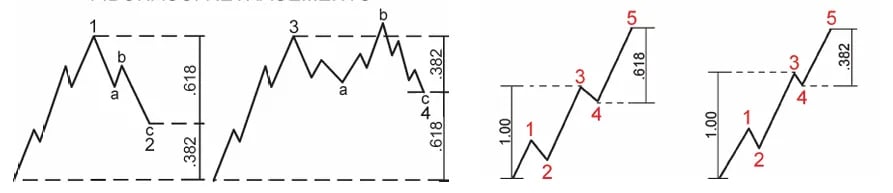
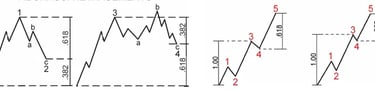
Elliott Wave incorporates proportional relationships, often expressed through Fibonacci ratios.
Elliott waves follow specific proportions—they often relate by 0.382, 0.618, 1.618, 2.618, or simple equality.
Rather than guessing how far a move might extend, traders can:
Identify common projection zones
Anticipate areas of exhaustion or acceleration
Define reward expectations before entry
This shifts focus from hope to preparation.
Knowing When a Trade Is Invalid
Perhaps the most practical advantage of Elliott Wave is its clear invalidation logic.
Elliott Wave gives you specific invalidation levels through three unbreakable rules:
Wave 2 can never retrace more than 100% of wave 1
Wave 4 can never terminate inside wave 1's price territory
Wave 3 can never be the shortest impulse wave
The framework includes strict structural rules that define when an interpretation is no longer valid. When these rules are broken, the analysis must be reassessed.
This clarity:
Removes emotional attachment
Prevents prolonged drawdowns
Reinforces disciplined exits
Structure determines when a premise fails — not opinion.
Why Context Matters More Than Signals
Many methods identify signals. Elliott Wave provides context.
It explains:
Why a signal may work or fail
Whether momentum is expanding or fading
How the current move fits into a larger narrative
This context improves decision-making regardless of the tools used alongside it.
How This Lesson Fits the Series
This lesson establishes why Elliott Wave functions as a complete analytical framework rather than a standalone indicator.
The next lesson builds on this foundation by explaining which waves consistently offer the clearest trading opportunities, and which phases are usually best avoided.
Elliott Wave Trading Course Series
This article is part of the Elliott Wave Trading Course.
Lessons in this series:
Part 2: The Simple Market Structure That Explains Every Price Move
Part 3: Why Elliott Wave Provides More Context Than Traditional Indicators
Part 4: The Elliott Wave Phases That Offer the Clearest Trading Opportunities
Part 7: Corrective Wave Structures and Fibonacci Relationships in Elliott Wave
Part 8: Applying Elliott Wave Structure with Confirmation-Based Trade Execution
Part 9: Risk Management and Psychology
Disclaimer:
Trading forex involves significant risk and may not be suitable for all investors. Past performance is not indicative of future results. The information and signals provided on this website are for educational purposes only and should not be considered financial advice. You are solely responsible for your trading decisions and any resulting financial losses. Please consult with a licensed financial advisor before engaging in forex trading.
© 2026. All rights reserved.
Trading Resources: [Market Insights] [Elliott Wave Course] [Forex Signals Guide] Tools: [Economic Calendar ][Position Size Calculator] Support: [FAQ] [Contact] [New To Telegram?]