Free 14-Day Access ON TELEGRAM
USD/CAD Elliott Wave Breakdown: Potential Wave 3 in Play
USD/CAD shows a clean five-wave decline from the February 2025 highs. Our Elliott Wave count suggests a developing Wave 3 scenario, with short-term downside potential and an alternate Wave C projection.
12/12/2025


Daily Chart Outlook: The Bigger Picture Unfolding
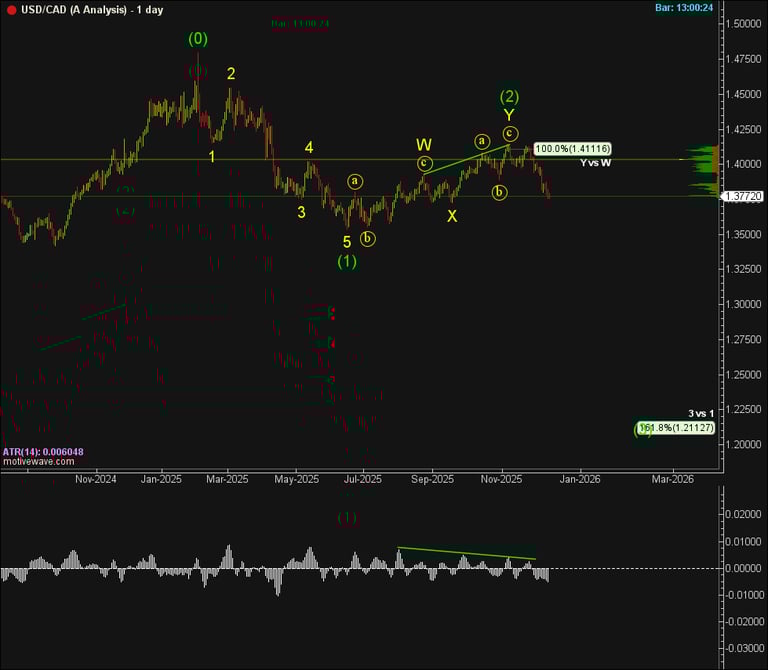
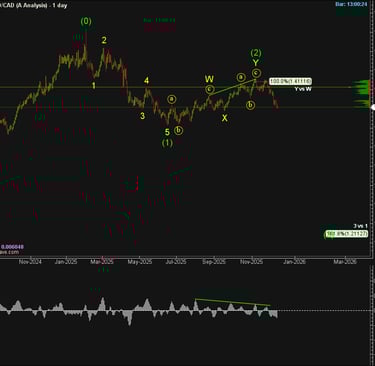
Looking at the daily chart, USD/CAD has completed a clear five-wave motive sequence to the downside from the February 2025 high at 1.4800.
What stands out is how well-defined the correction into Wave 2 has been — forming a WXY double zigzag, with Wave Y terminating exactly at the 100% Fibonacci extension of Wave W.
This is textbook structure — and it’s further supported by MACD divergence, giving added confidence that the bounce was corrective, not impulsive.
Our primary Elliott Wave count treats the decline from the Feb 2025 highs as a completed Wave 1, with price now unfolding within a larger Wave 3 — a move that typically carries the most momentum in a trend cycle.
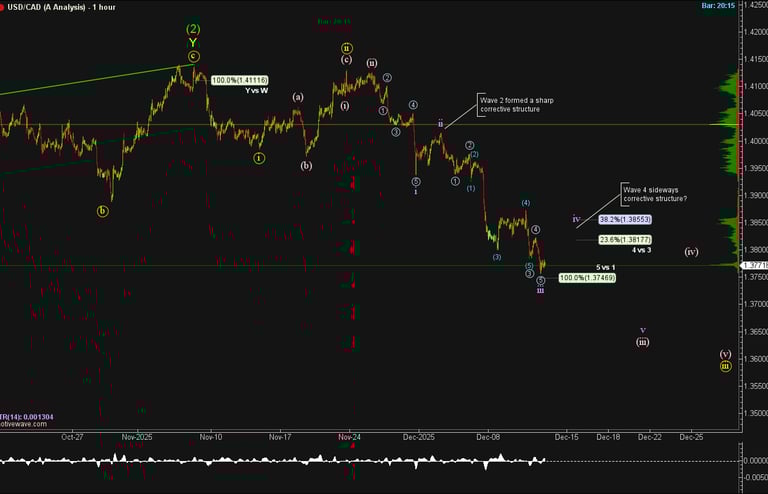
H1 Chart: Zooming In on Short-Term Structure
On the 1-hour chart, the substructure continues to support this thesis.
We appear to be in the heart of Wave 3 of the new motive sequence, and there’s an active short opportunity potentially in play.
Notably:
Wave 2 within this leg down was sharp — suggesting that the coming correction (Wave 4) should follow the Guideline of Alternation, ideally forming a sideways consolidation.
If this happens, and the next leg is impulsive to the downside, it would add strong confirmation that this structure is indeed unfolding as a Wave 3 — not a choppy correction.
We’re monitoring the following key retracement zones for Wave 4:
23.6% = 1.3817
38.2% = 1.3855
A rejection from these levels with a breakdown into new lows would reinforce our bearish bias.
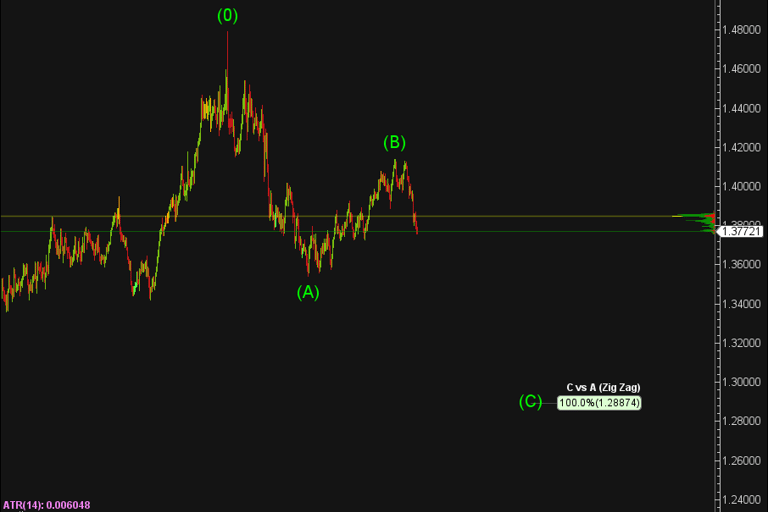
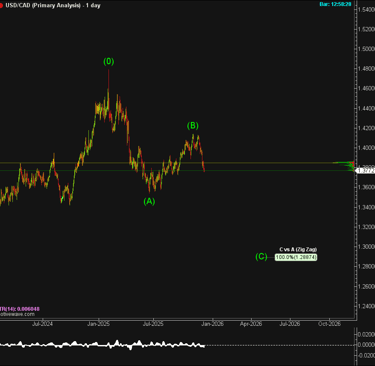
Alternate Count: Could It Be Wave C Instead?
There’s also an alternate view to consider.
The decline from the Feb 2025 highs may be unfolding as a Wave A, not Wave 1 — meaning the current leg down would be part of a larger ABC correction with Wave C now developing.
Under this scenario:
The next impulsive wave down would still occur.
However, the overall corrective structure would be larger and potentially terminal, rather than part of a sustained new trend.
As always, the structure and slope of upcoming moves will reveal which scenario is correct.
Wave 3s are typically steep and extended, while Wave C legs can often be shallower and end with overlapping price action.
Key Technical Levels to Watch
1.3855 – 38.2% Fibonacci retracement of the current leg (potential Wave 4 resistance)
1.3817 – 23.6% retracement (minor resistance to watch)
1.3747 – 100% extension of Wave 1 vs. Wave 5 (short-term downside target)
1.2887 – 100% extension of Wave A vs. Wave C (alternate count’s projected low)
Final Thoughts
USD/CAD is offering a clean Elliott Wave roadmap right now.
Whether this is a powerful Wave 3 unfolding or a more terminal Wave C correction, the coming weeks should provide the clues we need.
At The Signal Service, we continue to monitor momentum, retracement behavior, and slope to confirm whether to stay short — or prepare for reversal setups at lower levels.
📉 Bias: Bearish
🔎 Focus: Clear retracements, momentum divergence, and impulsive follow-through
Stay disciplined — and let the structure guide the risk.
Explore more in-depth charts and wave counts in our full Market Insights section.
Disclaimer:
Trading forex involves significant risk and may not be suitable for all investors. Past performance is not indicative of future results. The information and signals provided on this website are for educational purposes only and should not be considered financial advice. You are solely responsible for your trading decisions and any resulting financial losses. Please consult with a licensed financial advisor before engaging in forex trading.
© 2026. All rights reserved.
Trading Resources: [Market Insights] [Elliott Wave Course] [Forex Signals Guide] Tools: [Economic Calendar ][Position Size Calculator] Support: [FAQ] [Contact] [New To Telegram?]