Free 14-Day Access ON TELEGRAM
Essential Elliott Wave Guidelines and Characteristics
The following guidelines are drawn from both classical Elliott literature and extensive real-market observation — refined for practical use in trading and analysis.
1. Wave Relationships and Proportions
When one wave extends, the other two tend toward equality.
If Wave 1 extends, Waves 3 and 5 often mirror each other.
If Wave 5 extends, Waves 1 and 3 often share similar lengths.
In a zigzag or flat, Wave C generally does not exceed 1.618 × Wave A.
The golden ratio can often be projected from either the start or end of Wave 4 to forecast the potential reach of Wave 5.
Wave X, when occurring in double or triple combinations, is typically a zigzag and tends to be steeper than Wave W.
2. Alternation Between Waves
The principle of alternation is one of the most useful guidelines for anticipating wave structure.
If Wave 2 is sharp or simple, then Wave 4 will usually be sideways and complex — and vice versa.
The same alternation applies within corrective patterns:
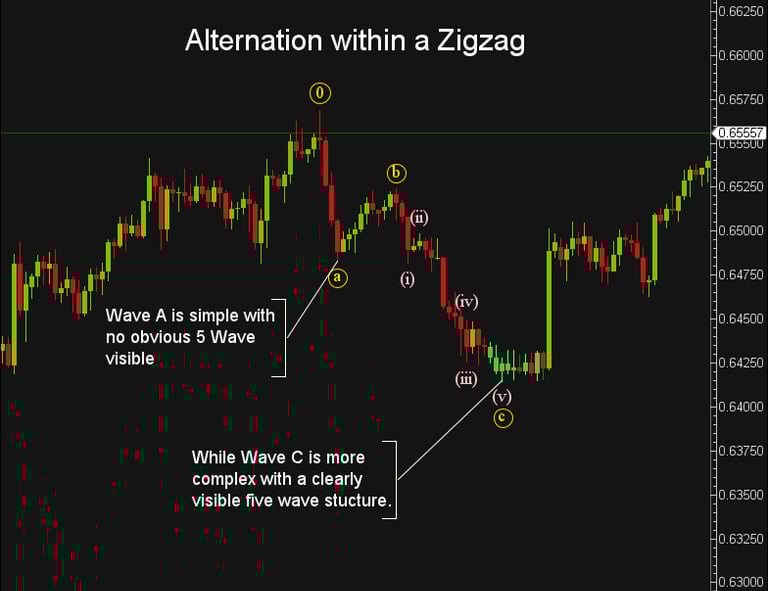
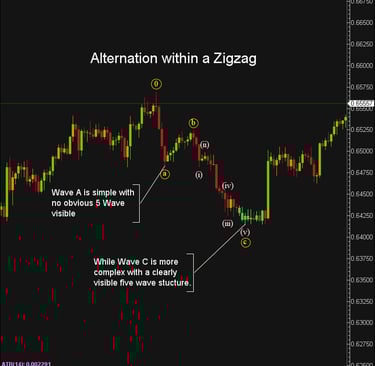
In a zigzag, if Wave A is simple and quick, Wave C often develops a clearer five-wave substructure, showing a “wind-out” of momentum before the correction completes.
In flats, if Wave A is complex, Wave C tends to be simpler and more decisive.
Recognising this balance helps you anticipate the texture of upcoming waves even before they form.
3. Slope and Momentum Characteristics
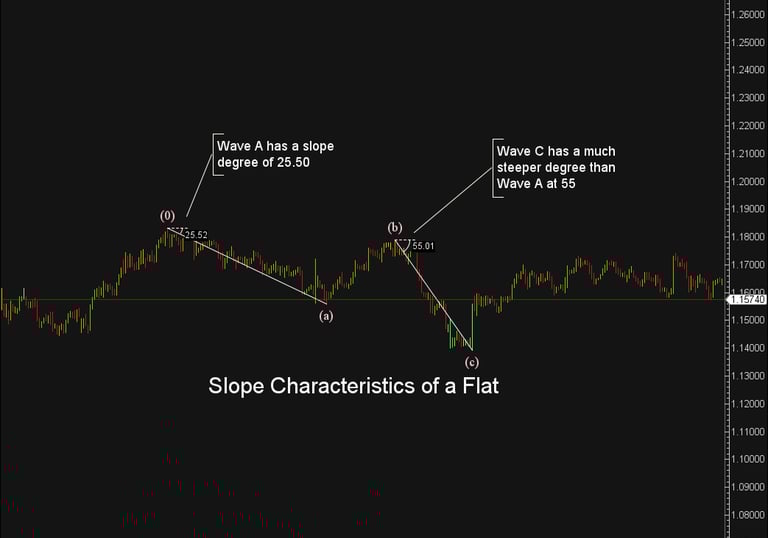
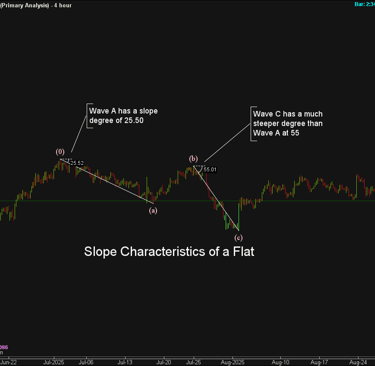
In a flat correction, Wave C is usually steeper than Wave A, showing a more aggressive attempt to complete the correction.
In a zigzag, both Waves B and C are generally less steep than the sharp and decisive Wave A, which often sets the tone of the correction.
When the slope flattens across consecutive corrections, it often signals a loss of momentum and transition toward a larger corrective structure.
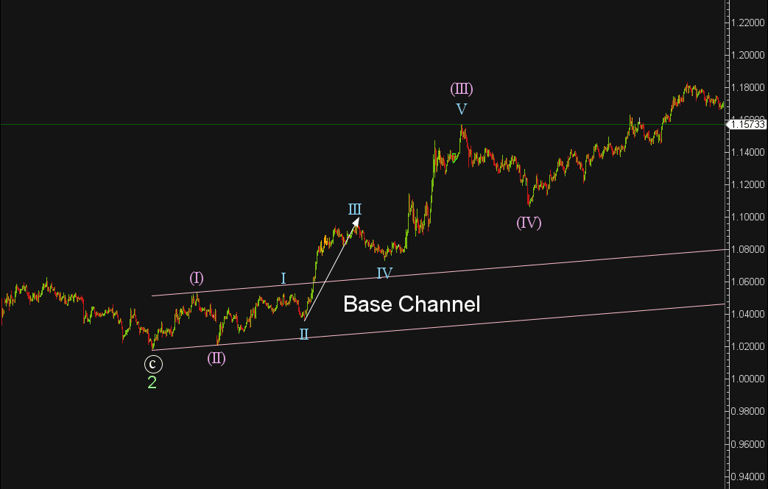
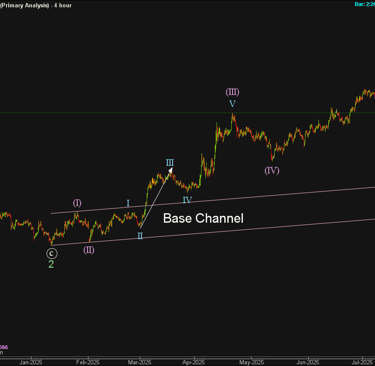
4. Channel Behaviour and Trend Confirmation
When identifying an early 1–2 setup, the subdivisions of Wave 1 of 3 should stay contained within the base channel drawn through the end of Wave C and Wave 2.
Wave 3 should blast through the upper boundary of this channel as momentum peaks — a sign that the impulse is gaining strength.
During strong trends, corrections are typically shallow and short-lived, as the market resists deeper pullbacks due to dominant momentum.
5. Triangles and Event Timing
In a contracting triangle, Wave C is usually the most complex leg — though occasionally, Wave B or D may take that role.
A major news event often coincides with the termination of Wave E, marking the emotional climax and the start of a powerful breakout.
The slope of the triangle lines (especially when narrowing aggressively) often reflects volatility compression before expansion.
6. Diagonals
In ending diagonals:
Wave 2 ≈ 78.6% of Wave 1
Wave 5 ≈ 78.6% of Wave 3
A truncated Wave 5 in a diagonal often indicates a pending explosive reversal.
In most diagonals, Wave 3 ≈ 78.6% of Wave 1, and Wave 5 ≈ 78.6% of Wave 3 — reflecting symmetrical weakening in momentum.
7. Running Flats and Complex Corrections
In a running flat, Wave B retraces at least 50% of Wave A — and often exceeds its start.
Most complex corrections begin with a Flat structure for wave W.
If slope remains shallow and repetitive, expect a 1–2, 1–2 sequence instead — the market is still coiling for a stronger breakout.
Combinations (W–X–Y) tend to appear in Wave 2, Wave 4, and B waves, blending flats and zigzags to extend time without major retracement.
How to Use These Guidelines in Real Trading
When you apply these principles to a chart, Elliott Wave analysis transitions from theory to actionable strategy.
You can:
Identify where the market currently sits within a larger structure.
Gauge whether a correction is nearing completion or just beginning.
Avoid false counts that ignore slope or proportion logic.
Align entries with impulsive momentum waves — especially Wave 3s or terminal C waves
.
By combining wave count with slope, proportion, and alternation, you can trade with a clear structural bias rather than reacting to noise.
Final Thoughts: Turning Rules into Real-World Strategy
Anyone can memorise the rules.
But trading mastery comes from understanding the guidelines.
It’s the alternation, slope, and internal proportions that reveal the market’s intent.
Those who can read these dynamics in real time don’t just label waves — they anticipate the rhythm and plan trades ahead of the crowd.
Elliott Wave is not about perfection; it’s about context.
Once you internalise the guidelines, every chart becomes a map of probability and structure — a dynamic puzzle that rewards precision and patience.
Stay tuned for our upcoming post on one of the guidelines I consider to be the most important - The Guideline Of The Right Look.
Learn about the Elliott Wave Principle.
Disclaimer:
Trading forex involves significant risk and may not be suitable for all investors. Past performance is not indicative of future results. The information and signals provided on this website are for educational purposes only and should not be considered financial advice. You are solely responsible for your trading decisions and any resulting financial losses. Please consult with a licensed financial advisor before engaging in forex trading.
© 2026. All rights reserved.
Trading Resources: [Market Insights] [Elliott Wave Course] [Forex Signals Guide] Tools: [Economic Calendar ][Position Size Calculator] Support: [FAQ] [Contact] [New To Telegram?]