EUR/USD – Two Paths After the Impulse: Flat or One Last Push?
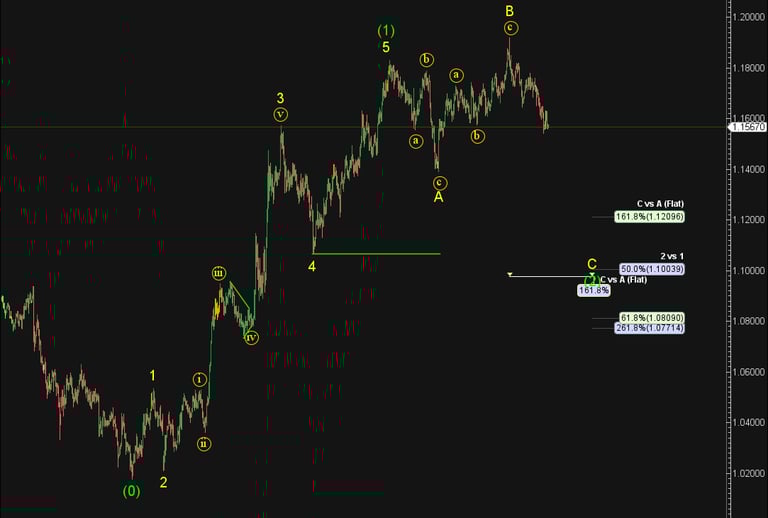
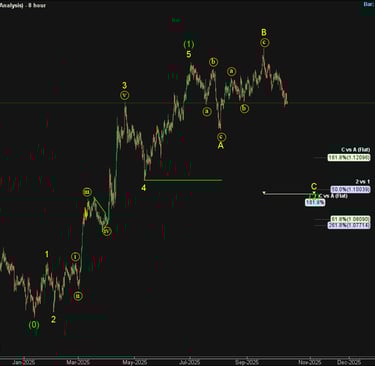
From the January 2025 low near 1.018, EUR/USD appears to have completed a clean 5-wave impulsive advance, with the final wave potentially terminating around 1.1830. What we may be witnessing now is the beginning of a flat correction to unwind that entire move—potentially playing out as an expanded flat structure.
So far, we've seen a 3-wave move down (Wave A), followed by another 3-wave move higher (Wave B), which fits the criteria for a flat correction. If this scenario continues, the next leg would be a Wave C to the downside, with the first area of projected support near 1.1200—where C equals 100% of A.
A Quick Guideline on Flats and Slopes
In classical Elliott Wave guidelines, when a flat is in progress, Wave C often carries a steeper slope intensity than Wave A. This reflects increasing momentum and a sharper move. So if we do begin to see price pushing lower in a faster, more aggressive fashion, it may actually support the idea that a C wave is unfolding—especially if price respects the 1.618% relationship with Wave A, a common relationship between Wave C and Wave A in an expanded flat.
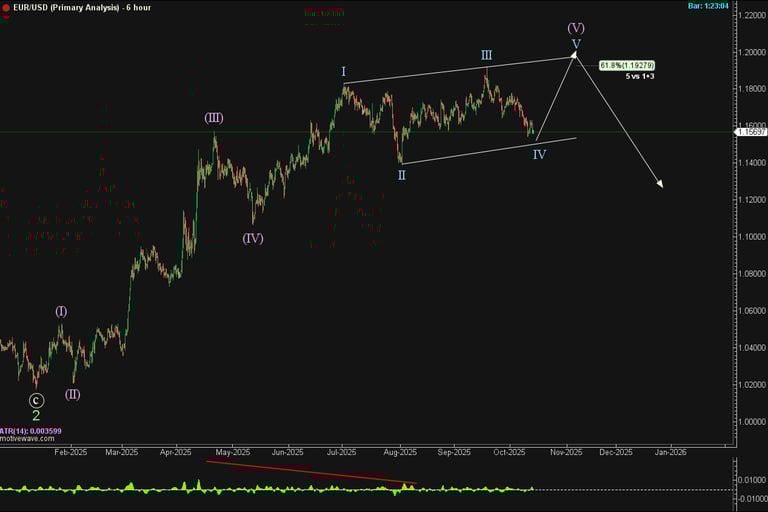
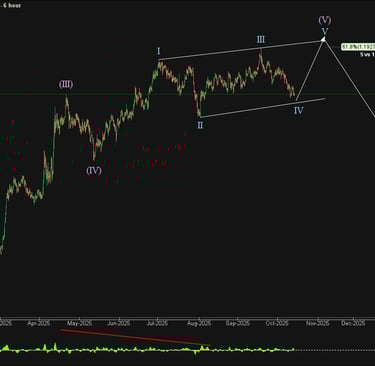
Alternate Count: One More Push?
In our alternate scenario, Wave 5 may not be complete, and price could make one more attempt toward the 1.1920 area before any deeper correction begins. We’ve mapped this out on the second chart, which reflects a possible continuation of the impulse into a more extended structure.
If that happens, we’d be looking for signs of an ending diagonal fifth-wave (3-3-3-3-3) into the highs, and only then would we expect a broader correction to begin.
As always, if the structure shifts away from either of these scenarios, we’ll keep you updated. Something more complex—like a triangle or double three—may be in play if the market fails to follow through.
Explore more in-depth charts and wave counts in our full Market Insights section.