Free 14-Day Access ON TELEGRAM
How to Use the COT Report in Forex Trading
How to use the COT report in Forex trading to confirm Elliott Wave structures like Wave 3 breakouts or Wave 5 exhaustion. Learn how positioning shifts and sentiment extremes can enhance your trade timing and confidence.
Using the COT Report For Forex Trading
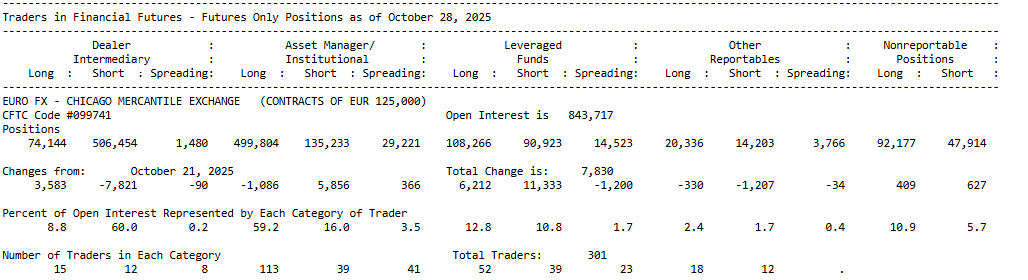
The Commitment of Traders (COT) report is a weekly sentiment indicator published by the U.S. Commodity Futures Trading Commission (CFTC). It shows how different trader groups are positioned in futures markets (including currency futures) as of each Tuesday’s close, with the data released on Friday afternoons. Forex traders can access COT data on the CFTC’s website or on financial portals and use it to gauge overall market sentiment. In simple terms, the report breaks down open interest (the total outstanding contracts) into Commercial traders (hedgers and producers), Non-Commercial traders (large speculators like hedge funds), and Non-Reportable traders (small speculators/retail). Commercials typically use futures to hedge business exposure (e.g. a European exporter hedging EUR/USD risk), while non-commercials (large speculators) trade for profit and often drive market trends. Non-reportable positions are mostly retail and, due to their small size, have less impact on major moves.
Many Forex traders use the weekly COT report as a sentiment indicator. The report’s extremes and shifts often align with turning points and the strength of trends. In general, COT-based strategies include:
Contrarian signals at extremes: Traders watch for very high or low net positions (e.g. speculators heavily long or short) as a potential reversal cue. In the words of one sentiment guide, “when everyone is fearful, be greedy; when everyone is greedy, be fearful”. Historical COT extremes (long or short) have often preceded big turns.
Trend confirmation via net positions: A healthy uptrend normally has rising prices accompanied by speculators adding long positions (while commercials hedge by selling). If price rallies and speculators aren’t buying (or commercials start buying), the trend may be weakening. In a sense, growing net-long COT positions can “confirm” a breakout or trend acceleration.
Divergence spotting: Major divergences between price action and COT positioning can foreshadow a reversal. For example, if EUR/USD makes a new high (Wave 5 in Elliott terms) but speculators’ net-long readings are flat or falling, that gap is a warning. Conversely, a sharp drop in price (a corrective wave) with speculators flipping to net-long may signal the end of the pullback. Watching for these price/COT divergences provides an early heads-up for trend changes.
These core concepts guide how to use the COT report in trading. In practice, traders often combine COT data with technical tools (like Elliott Wave counts) for stronger signals.
Trader Categories in the COT Report
Commercial (Hedgers): Businesses and producers (e.g. manufacturers, exporters) that use futures to hedge currency risk. They are often considered the “smart money” contrarians at market extremes, but they typically offset rather than drive price movements.
Non-Commercial (Large Speculators): Institutional funds, hedge funds, CTAs and other speculators trading for profit. These large traders often set the direction of major trends. A heavy net-long or net-short among non-commercials can powerfully influence price. Traders focus on these speculators because they “dominate the overall trend of the market.
Non-Reportable (Retail): Small-scale traders whose positions don’t meet the reporting threshold. These are mostly retail traders. While they add market interest, their positions are aggregated and less influential on big trends.
In practice, the most important data are the net positions of non-commercial traders (long minus short). A rapidly growing net-long position by speculators signals bullish conviction, while an extreme net-short suggests bearish consensus. For example, the CFTC shows EUR/USD speculative net-positions (long minus short); when that net is very high, it implies nearly everyone is bullish, often preceding a turn.
Interpreting COT Sentiment Extremes
COT data is interpreted through extremes and shifts. Sharp changes or record levels in net positions often coincide with key Elliott Wave turning points. Analysts watch for:
Extreme Readings: When net-long or net-short positioning reaches an extreme (multi-year high or low), it can mark a wave top or bottom. For instance, in July 2025 EUR/USD speculators held a near-record net-long position (an 18-month high). That extreme was flagged as unsustainable and indeed preceded a downtrend. In Elliott terms, such an extreme might mark the end of a Wave 5 or C wave.
Sudden Shifts or Divergence: If price forms a corrective rally (Wave 2 or 4), but COT sentiment moves oppositely or stalls, this divergence suggests the correction may be ending. For example, imagine EUR/USD is in a Wave 2 pullback (down in an uptrend), but speculators have already flipped to net-long; this “contrary signal” implies bears have capitulated and a new impulse (Wave 3) may start.
The COT data is often combined with price and volume to confirm trends. In uptrends, rising prices and rising open interest mean new money is fueling the move. But if price is rising while open interest falls (speculators aren’t adding new positions), it usually indicates a short-covering rally and fading momentum. In other words, a price high with declining open interest is a classic bearish divergence – a likely signal that a Wave 5 top may be forming.
Confirming Wave 3 Breakouts
Wave 3 is typically the strongest, most impulsive wave, so it often coincides with a surge in commitment by large speculators. When a bullish Wave 3 starts in EUR/USD, you may see speculators build net-long positions quickly. Watching the COT report to see how the contracts are positioned can help confirm a Wave 3 breakout. In practice: if EUR/USD breaks above the Wave 1 high (or a major resistance) with a strong surge, check the COT: a jump in net-long positions by non-commercials would validate that momentum is broad-based.
Spotting Wave 2/4 Endings
Corrective waves (2 and 4) should end before the next impulse wave. COT can help flag these endings. Look for:
Exhaustion of corrective sentiment: If a corrective rally (Wave 4) is underway and COT shows speculators are already heavily bullish (or if price retraced on declining open interest), the correction may be over.
Divergence between price and COT: For instance, if EUR/USD is rising in a downtrend in what looks like a shallow Wave 4, but speculators’ net-long position is NOT growing (or is shrinking), it indicates fading commitment. This divergence suggests Wave 4 may be ending, and Wave 5 down is imminent.
Sudden positioning shifts: A fast move in net positions can mark an inflection. If traders rapidly flip from net-short to net-long during a pullback, it often means they expect the pullback to end – a bullish sign for the next impulsive wave (Wave 3). Likewise, in a bearish sequence, a sudden jump in net-short on COT as price rallies in Wave 4 would hint at an early Wave 5 decline.
By watching for these COT patterns at Elliott pivot points, traders gain extra confidence. For example, if EUR/USD nears a projected Wave 2 bottom or Wave 4 bottom in an uptrend (say a 61.8% fib retracement), but COT shows speculators already adding longs, it “confirms that a corrective structure is ending” and a new impulse is likely to start soon.
Fading Momentum in Wave 5 (Open Interest Divergence)
The final Wave 5 often shows weaker momentum than Wave 3. In COT terms, watch for signs of “weakening hands” at a Wave 5 top:
Open Interest Divergence: If prices rise (into Wave 5) but COT positioning is showing more buying in short contracts, it often means the rally is fueled by short-covering rather than genuine new buying. In other words, fewer new buyers are committing fresh money. This is a classic sign that an uptrend is running out of steam. For example, if EUR/USD makes a new high in Wave 5 but speculators’ net-long shrinks, that divergence warns of an impending reversal.
Speculator Extremes: Wave 5 often ends near sentiment extremes. If speculators reach record bullishness (or contrarily, commercials show extreme positioning), it’s a red flag.
Declining Volume/OI: Even without COT, standard Elliott teaching says volume (and open interest) tends to decline in wave 5. Combine this with COT: if open interest and speculator participation lag while price advances, it confirms a fading commitment.
In summary, a bearish divergence (price up, open interest down) and COT extremes at a presumed Wave 5 peak strongly suggest momentum is fading. Traders can then look for reversal setups or tighten stops, using COT to back up the Elliott count.
Practical Tips: Using COT in EUR/USD Trading
Check Weekly COT Data: Remember the report is weekly (data to Tue, published Fri). Mark your calendar and compare the latest COT readings to your wave count.
Watch Net Position Changes: Rapid week-to-week jumps in net-long or net-short positioning are clues. A big swing in COT often comes after a wave 2 or 4 low/high.
Trend Confirmation: When you call a Wave 3 start, look for COT to confirm. If price breaks out and COT net-long is rising, it’s a strong green light.
Exhaustion Warning: If you’re in a Wave 5 and COT shows stagnant or reversing sentiment (or if open interest drops), be cautious. That’s often when Wave 5 tops and reversals occur.
Focus on Speculators: Most analysis focuses on non-commercial positions, but also note commercial hedgers. If commercials (the opposite side of speculators) suddenly accumulate positions, they are often contrarians signalling a turn.
By melding COT insights with Elliott Wave, traders gain extra confirmation. In practice, this means using the report to filter signals: only take long Wave 3 breakouts when COT backs them, and treat five-wave targets with caution if COT is unsupportive. Over time, this synergy helps identify high-probability zones (e.g. where a Wave 2/4 ends and Wave 3 begins) and warn of likely exhaustion points (fifth-wave tops).
Key Takeaways: The COT report is a snapshot of market positioning by trader type. In Forex trading, watch the net positions of large speculators for sentiment clues. Use the COT to spot extremes or divergences near Elliott Wave pivots: extreme net-longs at a presumed Wave 5 top or a sudden speculator flip at a Wave 2/4 bottom.
Explore more articles on our main blog page.
Disclaimer:
Trading forex involves significant risk and may not be suitable for all investors. Past performance is not indicative of future results. The information and signals provided on this website are for educational purposes only and should not be considered financial advice. You are solely responsible for your trading decisions and any resulting financial losses. Please consult with a licensed financial advisor before engaging in forex trading.
© 2026. All rights reserved.
Trading Resources: [Market Insights] [Elliott Wave Course] [Forex Signals Guide] Tools: [Economic Calendar ][Position Size Calculator] Support: [FAQ] [Contact] [New To Telegram?]