Free 14-Day Access ON TELEGRAM
AUD/USD Wave 5 Trading Setup: Elliott Wave Analysis & Forecast
Discover a structure-based AUD/USD Elliott Wave forecast targeting Wave 5. Learn key support zones, trade outlook.
3/2/2026
Introduction: AUD/USD Uptrend from Late 2025 Lows
The Australian Dollar vs US Dollar (AUD/USD) has been in a steady uptrend since the late-2025 lows. In fact, after bottoming out around 0.6420 in November 2025, the pair staged a bullish breakout in early December and transitioned into a medium-term uptrend. By early January 2026, AUD/USD had already climbed about 5% off those lows, reaching the high-0.67s. This strong advance lays the foundation for our latest AUD/USD forecast, which leverages Elliott Wave forex analysis to identify a high-probability Wave 5 trading setup. In this post, we’ll break down the Elliott Wave structure behind the recent rally, pinpoint the key support zones for the ongoing Wave 4 pullback, and highlight the projected Wave 5 target. This analysis is aligned with our structure-based approach to forex signals, focusing on technical pattern setups for trade entries.
Elliott Wave Structure: 5-Wave Motive Pattern in AUD/USD
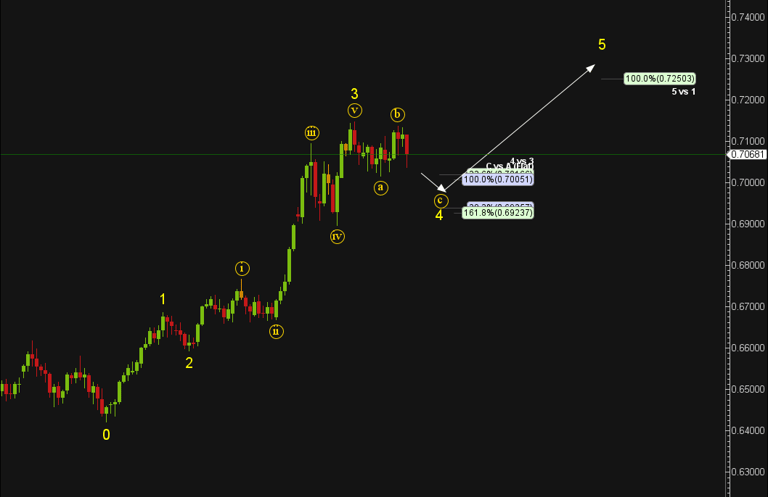
From the December 2025 low through the first months of 2026, AUD/USD appears to be unfolding a classic 5-wave motive pattern as outlined by Elliott Wave Theory. In an impulsive uptrend, the market advances in five waves (labeled 1 through 5) in the direction of the trend, with waves 1, 3, and 5 being upward “motive” waves separated by corrective pullbacks (waves 2 and 4). In the case of AUD/USD:
Wave 1 kicked off the rally from the late-2025 bottom, establishing the initial bullish leg off 0.64–0.65.
Wave 2 was a brief corrective pause (a shallow pullback) that set a higher low (the pair only retraced modestly, reflecting strong bullish sentiment).
Wave 3 then emerged as an extended, powerful advance. Indeed, wave 3 carried AUD/USD to multi-month highs, peaking in mid-February 2026 around 0.7146 (the highest level in over a year). This third wave was the largest and most dynamic move, consistent with Elliott Wave guidelines that Wave 3 is often the strongest impulse wave. By the end of Wave 3, the pair had decisively broken above several resistance levels, confirming a positive trend structure.
At present, Wave 4 is in progress, unfolding as a corrective pattern. Notably, this Wave 4 appears to be taking the shape of a flat correction, a common Elliott Wave structure for fourth waves. In a flat, the market traces an A–B–C sequence that overall moves sideways/downward against the trend. Typically, wave A and B consist of three sub-waves each, and wave B often nearly revisits the prior high, while wave C is a five-wave decline that ends around the same level as wave A or slightly beyond. In AUD/USD’s case, after the Wave 3 peak (~0.7126), the pair dipped for wave A, rebounded close to the highs for wave B (a “flat” because wave B remained near the Wave 3 top), and is now in the final wave C of the correction. Importantly, Wave 4 has remained a relatively shallow and sideways correction so far – typical behavior, as fourth waves often alternate with the sharper Wave 2 (which was brief and shallow, so Wave 4 can be a longer sideways flat). This positioning in Wave 4 sets the stage for an upcoming Wave 5 rally once the correction completes.
Wave 4 Corrective Flat: Key Support Zones for Completion
As Wave 4 plays out, we are monitoring two key support zones derived from Fibonacci analysis and Elliott Wave projection, which should mark the completion of this corrective flat before Wave 5 uptrend resumes. Based on the A–B–C structure of the flat, we specifically estimate where wave C of 4 may bottom out:
0.7005 – This level is a critical support zone for a shallow Wave 4. It represents a 100% Fibonacci extension where wave C would equal the length of wave A (i.e., C = A). In flats, it’s common for wave C to travel a distance equal to wave A. Moreover, 0.7005 coincides with roughly a 23.6% retracement of the entire Wave 3 rally (the move from the Wave 2 low to the Wave 3 high). Such a minor retracement is plausible if the uptrend is very strong. Indeed, AUD/USD briefly dipped to the low-0.70s in early March, approaching this zone. The pair showed buying interest around 0.703–0.705, suggesting the first support level has been recognized by the market.
0.6945 – 0.6920 This is a deeper support zone marking the lower bound of a potential Wave 4 pullback. It corresponds to roughly a 1.618× extension of wave A (an extended wave C scenario) and aligns with about a 38.2% retracement of the Wave 3 advance. While a standard flat often sees wave C terminate near parity with wave A (as noted above), an “expanded flat” can see wave C stretch toward the 1.236–1.618 extension of wave A. 0.6923 (around 0.69 handle) would be an aggressive downside target for wave C – essentially the maximum depth for a flat correction without invalidating the Elliott Wave count.
In summary, Wave 4 appears to be a flat consolidation, and we expect it to find support and bottom out in the 0.7005–0.6923 zone. Traders will be watching for bullish reversal signals (such as basing patterns or momentum divergence) in this region, which would hint that Wave 5 is ready to begin. Thus far, the shallow end of this range (~0.6950) has held, but we remain alert to the possibility of a slightly deeper dip toward 0.69 if needed to complete the correction. Any break significantly below 0.6900, however, could suggest something else is afoot (invalidating the Wave 4 flat assumption), so these support levels are crucial for our bullish outlook to remain intact.
Projected Wave 5 Target: The 0.7250 Zone
Once Wave 4 concludes, Wave 5 – the final leg of the 5-wave motive sequence – is expected to carry AUD/USD higher again in the direction of the prevailing uptrend. Our target for Wave 5 is in the 0.7250 area. This projection is derived from multiple technical considerations:
Measured move symmetry: Wave 5 often mirrors the magnitude of Wave 1 when Wave 3 is extended (as in this case). If we assume a proportionate rally, a continuation toward the mid-0.72s is a logical extension from the Wave 4 low (especially if Wave 4 is shallow). For instance, if Wave 4 ends around 0.7000, a rally of similar size to Wave 1 could put Wave 5 in the 0.7250 region.
Prior resistance and Fibonacci extensions: The 0.7200–0.7250 zone may also line up with broader technical levels, such as a 78.6% retracement of the entire preceding downtrend or prior significant highs from earlier in 2025. It’s a round quarter-number as well, which often has psychological significance.
Elliott Wave guidelines: While Wave 3 was the largest push, Wave 5 can still extend reasonably. Given Wave 3 hit ~0.713, a Wave 5 that breaks that high and pushes another ~100+ pips could be feasible without being exaggerated. The AUD/USD forecast calling for 0.7250 as a target reflects a moderate Wave 5 (not too small, not too extended), aligning with our expectation of a balanced impulse wave completion.
It’s important to remember Wave 5 targets are projections, not guarantees. We will watch price action closely as Wave 5 progresses for any signs of truncation (if bullish momentum falters early) or overextension (if momentum is unexpectedly strong). However, the structure-based analysis currently favors the 0.7250 region as an attainable bullish target in the coming weeks, assuming the uptrend resumes as anticipated.
Structure-Based Signals Aligned with Our Trading Philosophy
This AUD/USD Wave 5 setup exemplifies The Signal Service’s technical, structure-based signal philosophy. We rely on robust chart analysis – like Elliott Wave patterns, Fibonacci levels, and trend structure – to identify high-probability trade setups. Rather than chasing random price moves, our forex signals are rooted in clear technical reasoning (in this case, the completion of a Wave 4 flat and the start of Wave 5). This approach ensures that each signal has a well-defined context (trend phase, support/resistance, etc.) and an understanding of where the trade idea would be proven right or wrong based on market structure.
Crucially, our service does not issue rigid stop-loss or take-profit levels with each signal. This is intentional and part of our risk management methodology. Why no fixed SL/TP? Because market structure is dynamic – especially in a scenario like an Elliott Wave flat, where volatility can briefly pierce a level before reversing. Instead, we manage risk through position sizing and active trade monitoring. Every signal comes with guidance on lot sizing (so you risk an appropriate, small percentage of your account per trade), and we provide real-time updates on trade management. If conditions change or the structure invalidates (for example, if AUD/USD were to decisively drop below 0.6900, negating the Wave 4 scenario), we will update or close the trade manually rather than relying on a pre-set stop. Similarly, take-profit is handled by monitoring the price action near target zones (like 0.7250 for Wave 5) and using trailing stops or exit signals based on momentum. This adaptive approach means risk is controlled by proactive management and sizing, not just fire-and-forget orders. It aligns with our belief in flexibility and discipline – we let the market action dictate our moves within the structure we’ve identified, rather than imposing arbitrary limits that might get hit unnecessarily.
For subscribers, this philosophy translates into clear instructions: focus on the structure (e.g. wait for Wave 4 to bottom, then ride Wave 5), use our lot size guide to scale your position safely, and follow our ongoing updates as we navigate the trade. By doing so, you can participate in high-confidence setups like this AUD/USD Wave 5 trade while keeping risk well-managed.
For more detailed wave-based forecasts and real-time setups, explore our full library of Market Insights
Disclaimer:
Trading forex involves significant risk and may not be suitable for all investors. Past performance is not indicative of future results. The information and signals provided on this website are for educational purposes only and should not be considered financial advice. You are solely responsible for your trading decisions and any resulting financial losses. Please consult with a licensed financial advisor before engaging in forex trading.
© 2026. All rights reserved.
Trading Resources: [Market Insights] [Elliott Wave Course] [Forex Signals Guide] Tools: [Economic Calendar ][Position Size Calculator] Support: [FAQ] [Contact] [New To Telegram?]